Introduction to web performance

If you are a web developer, I would assume that you have a good understanding of HTML, CSS, and JS; and you have created a few projects using these technologies. The next step is to get started with the basics of web performance. It is an important aspect a web developer must keep in mind while developing their web apps. At the end of the day, the consumer must have a good user experience and that is what ultimately matters.
In this era, everything has moved digital and the web has become more powerful than ever.
What is web performance
Web performance is all about making websites fast, including the ways of making slow processes seem fast. It involves loading a site quickly, allowing the user to start interacting with it faster, and offer reassuring feedback if something is taking time to load (e.g. a loading spinner)? Are scrolling and animations smooth?
Web performance includes both objective measurements like time to load, frames per second, and time to interactive, and subjective experiences of how long it felt like it took the content to load.
Lighthouse
Lighthouse is an open-source, automated tool for improving the quality of web pages. You can run it against any web page, public or requiring authentication. It has audits for performance, accessibility, progressive web apps, SEO, and more.
There are various metrics that contribute to calculating the lighthouse score. Some of the top considerations are as follows:
- First Contentful Paint
- Largest Contentful Paint
- Time to Interactive
- Total Blocking Time
- Cumulative Layout Shift
- First Input Delay
Let's understand them one by one.
First Contentful Paint (FCP)
FCP measures how long it takes the browser to render the first piece of DOM content after a user navigates to your page. Your FCP score is a comparison of your page's FCP time and FCP times for real websites, based on data from the HTTP Archive. LCP measures when a user perceives that the largest content of a page is visible. The metric value for LCP represents the time duration between the user initiating the page load and the page rendering its primary content.
Once Lighthouse is done gathering the performance metrics (mostly reported in milliseconds), it converts each raw metric value into a metric score from 0 to 100 by looking where the metric value falls on its Lighthouse scoring distribution. To provide a good user experience, sites should strive to have a First Contentful Paint of 1.8 seconds or less.
Largest Contentful Paint (LCP)
LCP metric reports the render time of the largest image or text block visible within the viewport, relative to when the page first started loading. To provide a good user experience, sites should strive to have the Largest Contentful Paint of 2.5 seconds or less.
<img> elements, <svg> tag, <video> elements, background images loaded via url() function are the type of elements considered for LCP.
While calculating LCP, it takes into account the size of the element that's visible to the user within the viewport. If any of the above-mentioned elements extend outside the viewport, those portions would not contribute to the element's size. For all elements, any margin, padding, or border applied via CSS is not considered.
Time to Interactive (TTI)
The TTI metric measures the time from when the page starts loading to when its main sub-resources have loaded and it is capable of reliably responding to user input quickly.
Techniques like server-side rendering (SSR) can lead to scenarios where a page looks interactive (that is, links and buttons are visible on the screen), but it's not actually interactive because the main thread is blocked or because the JavaScript code controlling those elements hasn't loaded.
Total Blocking Time (TBT)
TBT mertic measures the total amount of time between FCP and TTI where the main thread was blocked for long enough to prevent input responsiveness.
As we discussed above, when users try to interact with a page that looks interactive but actually isn't, it's likely that the user will notice the delay and perceive the page as sluggish or janky.
Thus, try to minimize the difference between FCP and TTI for good user interactivity on your web pages.
TBT is a great companion metric for TTI because it helps quantify the severity of how non-interactive a page is prior it to becoming reliably interactive.
Cumulative Layout Shift (CLS)
CLS is a measure of the largest burst of layout shift scores for every unexpected layout shift that occurs during the entire lifespan of a page. To provide a good user experience, sites should strive to have a CLS score of 0.1 or less.
A layout shift occurs any time a visible element changes its position from one rendered frame to the next. The culprit might be an image or video with unknown dimensions, a font that renders larger or smaller than its fallback, or a third-party ad or widget that dynamically resizes itself.
Note that layout shifts only occur when existing elements change their start position. If a new element is added to the DOM or an existing element changes size, it doesn't count as a layout shift—as long as the change doesn't cause other visible elements to change their start position.
First Input Delay (FID)
FID measures the time from when a user first interacts with a page (i.e. when they click a link, tap on a button, or use a custom, JavaScript-powered control) to the time when the browser is actually able to begin processing event handlers in response to that interaction. To provide a good user experience, sites should strive to have a First Input Delay of 100 milliseconds or less.
The main aspect of Web 2.0 is the ability of a user to interact with the web page. Thus, FID is an important metric in web performance.
These were some of the important metrics to consider while working with web performance. I created this blog as documentation of my learnings. Here's the tweet about how I improved the lighthouse score of my portfolio website.
This is what happens when you get to have a productive session @neogcamp!
— Supriya Minnasandram 👩💻 (@supminn) August 21, 2021
Thank you @PKodmad for helping us understanding @____lighthouse
Worked on improving my portfolio site😁#webPerf #newLearnings #webDev #neogcamp #coding pic.twitter.com/ALbTQYnnYt
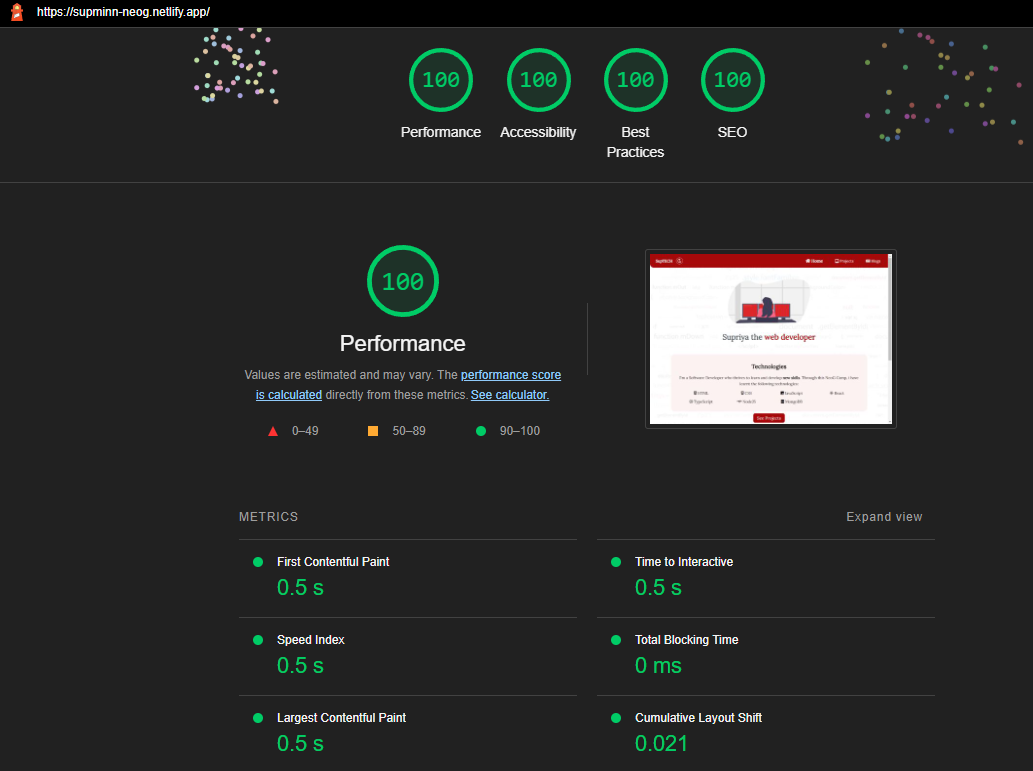
And this is the latest lighthouse report generated today!
Thank you for reading through this article. Let me know which topic should I explore and write about in the next article. You could share your thoughts in the comments section or DM me on Twitter. If this blog is interesting to you, I would appreciate it if you could give this post a like (with your favorite emoji 😁).
Peace ✌


